
Reading international demand from data, not anecdotes
Every international strategy review I have sat in starts the same way. The international head says that Iraq is soft this year because of the visa situation, that a facilitator in Dhaka has promised forty oncology patients a quarter, that there is a huge opportunity in Uzbekistan if we send a doctor for a camp, and that East Africa wants cardiac but only if we can match a competitor’s package price. All of it may be true. None of it is evidence, and the executive committee is being asked to allocate coordinators, language hires, travel budget and consultant time on the strength of it.
The domestic side of the business stopped working this way a decade ago. Nobody opens a unit in a Tier 2 city on the say-so of a well-connected local; they look at the catchment, the search volume, the competitor map and the payer mix. The international business has stayed anecdotal because the data looked hard to get and the relationships looked like the whole game.
The data is not hard to get. Most of it is already inside the group. What follows is how I have built a demand map by country and specialty, what it tends to say about where Indian hospitals genuinely win, and how to turn it into an allocation the CFO will sign.
What the anecdotes get wrong
Facilitator intelligence is not worthless. It is biased in three predictable ways. It reflects the markets the facilitator happens to operate in, not the markets that exist. It reflects the specialties he has found easy to sell, which are usually the ones with the simplest package price. And it is offered by someone whose income depends on you believing it, and who will describe a market as booming when he needs a better commission and as collapsing when a competitor has offered one.
The consultants’ view is biased differently: towards the countries whose patients they have personally treated and enjoyed, and the procedures they most want to do. Both views are inputs. Neither is a map.
The sources you already have
Building the map means joining four kinds of data that currently sit in four different places.
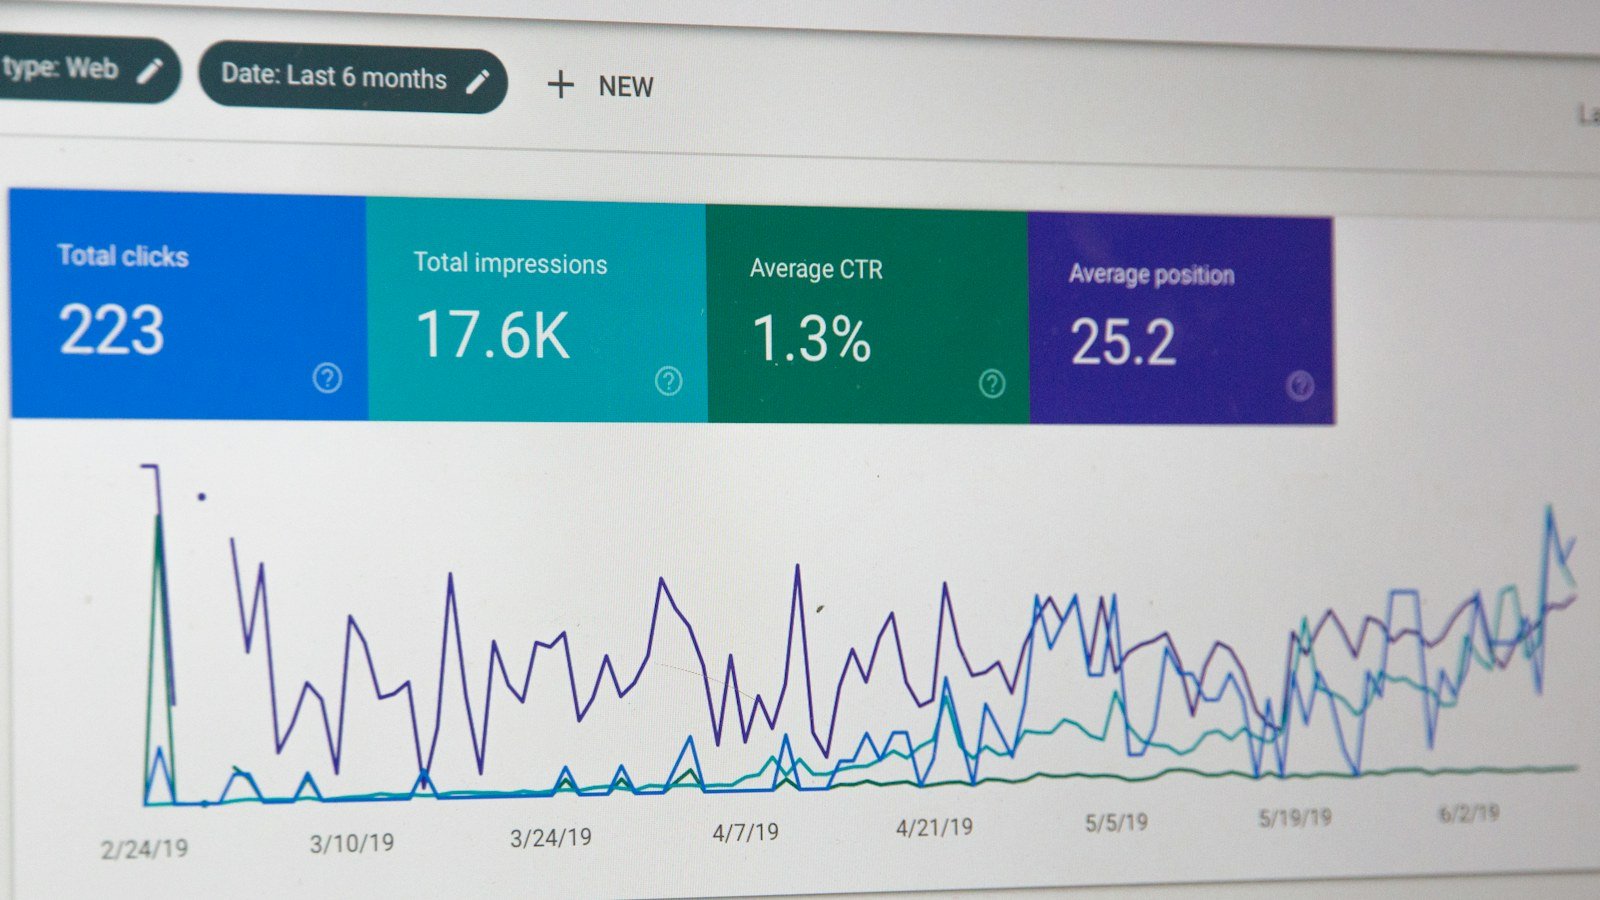
- Search data by geography. Your own site analytics, filtered by the visitor’s country, tell you which conditions and which doctors people in Nigeria or Bangladesh or Oman are looking at. The search console tells you what queries brought them. Public trend tools tell you the relative volume of procedure terms plus ‘India’ or ‘hospital’ by country over time, which is a crude but honest proxy for intent. None of this costs anything.
- Enquiry data. Every international enquiry the group has ever received, if it was logged, carries a country, a specialty, a source and an outcome. If it was not logged — because it lived on coordinators’ phones — the first act of the demand map is to start logging, in the CRM, with those fields mandatory. Six months of clean enquiry data is worth more than five years of anecdote.
- Admission data. What actually came, from where, for what, at what realised revenue and margin, through which source. This is the denominator every other number needs, and it is the one the finance team already trusts.
- Public data. Government figures on medical visas by nationality, published intermittently and in aggregate, are enough to size a market and to see it move when a border or a visa rule changes. Add the visible activity of competitors — which languages their sites carry, which countries they are advertising in, which cities their doctors are visiting — and you have the competitive layer.
The join is by country and specialty. The output is a grid, and the grid is the argument.
Building the grid
Rows are source countries. Columns are the specialties the group actually wants to sell internationally — typically cardiac, oncology, orthopaedics and joint replacement, neurosciences, transplant where the law and the programme allow, fertility, bariatric, paediatric surgery. Each cell carries a few numbers: the search signal, the enquiries in the last two quarters, the admissions, the conversion from enquiry to admission, the realised margin, and the share that came direct versus through a facilitator.
What the grid shows, almost immediately, is that the international business is far more concentrated than anyone had said. A handful of cells — often fewer than ten — account for the bulk of the volume and most of the margin. A long tail of countries generates enquiries that never convert, because the visa is hard, or the payment is impossible, or the facilitator was promising something the hospital does not do. And there are usually one or two cells with strong search signal, rising enquiries and almost no admissions, which is the shape of a market the group is losing to someone else.
I would put that grid in front of the executive committee before any conversation about strategy. It replaces a debate about whose anecdote is right with a debate about which cells to fund.
Where India actually wins
The grid has said broadly the same thing in every group I have seen it built for, and it lines up with what the public visa data shows. It is worth stating plainly, because it is not the story the facilitators tell.
India wins on complex tertiary care where the price gap with the alternatives is large and the outcome gap is small or nil. Cardiac surgery and intervention. Joint replacement and spine. Solid tumour oncology, especially where radiotherapy and surgery can be sequenced in one place. Liver and kidney transplant, within the legal framework for foreign nationals, for the countries where a related donor travels with the patient. Neurosurgery. Paediatric cardiac surgery, which is close to a category of its own.
It wins from the countries where those procedures are either unavailable or unaffordable at home and where India is reachable, trusted and visa-feasible: Bangladesh above all, then Iraq and Yemen, the East African corridor from Kenya to Ethiopia, Nigeria, Oman and the Gulf for specific specialties, the Maldives, Myanmar, and the Central Asian republics. The mix shifts by city — a hospital in the south sees a different Bangladesh than one in the east, a Hyderabad or Mumbai unit sees more Gulf traffic than a Kolkata one — but the pattern is stable.
It does not win on everything. It does not reliably win on cosmetic and elective wellness, where Thailand and Turkey have built brands that India has not. It does not win in markets where a facilitator has to be paid so much that the margin disappears. And it does not win on the specialties where a group has no distinctive programme, however hard the international desk pushes them — the search data will show the interest is not there and the enquiry data will show it does not convert.
Reading the cells
Once the grid exists, four kinds of cell need four different decisions, and this is where judgement re-enters.
- High volume, high margin, facilitator-heavy. The core. Protect it by building a direct channel alongside the facilitator one, so the concentration risk falls without the volume falling. This is where language hires and source-market content go first.
- Rising search, rising enquiries, low admissions. A market you are losing. Find the break: usually the visa letter is slow, the estimate is uncompetitive or unclear, or nobody responds in the language. Fix the funnel before spending on demand.
- High enquiries, near-zero conversion. Usually a market where payment or visa is structurally blocked, or where a facilitator is generating enquiries to pad his numbers. Stop investing. Keep the channel open and cheap.
- Strong signal, no presence. The genuine opportunity. Test it with the cheapest instruments — a language page, a messaging line staffed for that market’s hours, a consultant video opinion — before anyone books a flight for a camp.
The camp deserves a word. Sending a consultant to a source country for three days of screening is the traditional instrument of international growth and it is the most expensive one. It works when the grid already shows demand and the funnel behind it is ready to convert. It fails, expensively, when it is the first thing tried in a market nobody has measured.
Allocating effort by evidence
The point of the map is the allocation, and the allocation has four scarce resources: coordinator hours by language, consultant time for opinions and camps, content and paid budget by market, and the attention of the international head. The grid ranks the cells by margin at stake and by how fixable the funnel is. The resources go to the top of the ranking. The bottom gets a standing channel and nothing more.
The conversation with the CFO becomes tractable at this point, because the ask is no longer ‘more for international’. It is a specific set of hires and spends against specific cells, each with a current admission number, a current margin, a target for the direct share and a date to review. I have found that a finance team that has been sceptical of the international business for years will fund it readily once it is presented as a portfolio of markets rather than a set of relationships.
What to be honest about
The map is only as good as the enquiry logging, and enquiry logging in an international desk is a cultural change that takes two or three quarters of insistence. The search signal is a proxy for intent, not a forecast; a border closure or a currency crisis moves a market faster than any data would predict. And the map will confirm some of the anecdotes — the facilitator who said Bangladesh wanted oncology was right — which is fine, because now the group knows it rather than believes it.
What the map cannot do is replace the relationships. It tells you where to spend them.
The order of operations
- Make country, specialty, source and outcome mandatory fields on every international enquiry in the CRM, from this month. Retrofit the last year from whatever records exist.
- Pull a year of international admissions with realised revenue and margin, by country and specialty, from finance. This is the anchor.
- Add the search layer: site analytics by country, search console queries, and public trend data for the procedure terms in your top ten countries.
- Build the grid. One page. Countries down, specialties across, the six numbers per cell.
- Classify the cells into the four kinds above and write one line of decision against each.
- Take the grid and the decisions to the executive committee with the resource asks attached to specific cells.
- Review the grid quarterly. Markets move; the map should move with them, and the anecdotes should be tested against it every time.
Two quarters in, the international review will still have the same people in the room telling the same stories. The difference is that there will be a page on the table that says which of the stories are true.
Agents sell you the markets they know. The data shows you the ones you are already losing.
Questions people ask
It is biased in three predictable ways. It reflects the markets the facilitator happens to operate in, not the markets that exist. It reflects the specialties he has found easy to sell, usually the ones with the simplest package price. And it comes from someone whose income depends on you believing it, who will call a market booming when he needs a better commission and collapsing when a competitor has offered one. It is an input. It is not a map.
Four kinds, sitting in four places. Site analytics filtered by visitor country, showing which conditions and doctors people in each market look at, plus search console queries and public trend tools. Enquiry data, if it was logged with country, specialty, source and outcome. Admission data from finance — what actually came, from where, for what, at what realised margin, through which source. And public data: medical visa figures by nationality and the visible activity of competitors.
One page. Rows are source countries; columns are the specialties the group actually wants to sell internationally — cardiac, oncology, orthopaedics, neurosciences, transplant where the law allows, fertility, bariatric, paediatric surgery. Each cell carries six numbers: search signal, enquiries in the last two quarters, admissions, enquiry-to-admission conversion, realised margin, and the direct versus facilitator share. The grid replaces a debate about whose anecdote is right with a debate about which cells to fund.
On complex tertiary care where the price gap with alternatives is large and the outcome gap is small: cardiac surgery and intervention, joint replacement and spine, solid tumour oncology, liver and kidney transplant within the legal framework, neurosurgery and paediatric cardiac surgery. From countries where those are unavailable or unaffordable and India is reachable and visa-feasible: Bangladesh above all, Iraq, Yemen, the East African corridor, Nigeria, the Gulf for specific specialties, the Maldives, Myanmar and Central Asia. Not on cosmetic or wellness.
The admission data from finance can be pulled in weeks and is the anchor. The search layer takes days. The constraint is enquiry data: if it lived on coordinators’ phones, the first act is to make country, specialty, source and outcome mandatory CRM fields from this month and retrofit the last year. Getting an international desk to log consistently is a cultural change that takes two or three quarters of insistence. Six months of clean enquiries beats five years of anecdote.
Treat it as a market you are losing to someone else and find the break before spending on demand. It is usually one of three things: the visa letter is slow, the estimate is uncompetitive or unclear, or nobody responds in the patient’s language. Fix the funnel first. Strong search signal and rising enquiries mean the interest already exists; buying more of it into a broken path only increases the number of families who go elsewhere.
Only when the grid already shows demand in that country and the funnel behind it is ready to convert. Sending a consultant for three days of screening is the traditional instrument of international growth and the most expensive one. It fails, expensively, when it is the first thing tried in a market nobody has measured. Test an unproven cell with cheaper instruments first — a language page, a messaging line staffed for that market’s hours, a video opinion.
Stop asking for more for international. Present a specific set of hires and spends against specific cells of the grid, each with a current admission number, a current margin, a target for the direct share and a review date. A finance team sceptical of the international business for years will fund it readily once it is presented as a portfolio of markets rather than a set of relationships. The admission data they already trust is the anchor for everything else.
An intermediary in the source country who refers patients to hospitals in India for a commission, often handling travel and visa. Facilitator-heavy cells are frequently the core of the international business — high volume and high margin — which is exactly the concentration risk. Protect them by building a direct channel alongside, with language hires and source-market content, so the concentration falls without the volume falling. In some markets the facilitator fee is so high the margin disappears entirely.
Make country, specialty, source and outcome mandatory fields, starting now, and accept that it will take two or three quarters of insistence. Coordinators have run on phones and relationships for years and will experience logging as distrust. The argument that lands is that the grid protects their best markets by making the case for resources explicit. Retrofit last year from whatever records exist, however imperfect, so the first version of the grid is not empty.
Very little in cash. Site analytics, search console and public trend tools are free. Finance already holds the admission and margin data. The CRM already exists. The real cost is the international head’s time to insist on logging, and the scarce resources the map then allocates: coordinator hours by language, consultant time for opinions and camps, content and paid budget by market. The map is how you decide where those go, not a new spend line.
Quarterly. Markets move faster than domestic ones — a border closure or a currency crisis shifts a country in weeks, faster than any data would predict — and the map should move with them. Each quarter, re-classify the cells, test the anecdotes in the room against the page, and adjust the resource allocation. Two quarters in, the same people will be telling the same stories; the difference is a page on the table that says which are true.
A single hospital can, and the grid will be smaller and faster to build. The sources are identical: its own site analytics by country, its enquiry log, its admissions and public visa data. The mix will be shaped by the city — a southern unit sees a different Bangladesh than an eastern one, and Hyderabad or Mumbai sees more Gulf traffic than Kolkata. What a single hospital cannot do is spread language hires across units, so the top cells matter even more.
Search signal is a proxy for intent, not a forecast, and geopolitics moves faster than data. The map is only as good as the enquiry logging behind it. It will confirm some anecdotes — the facilitator who said Bangladesh wanted oncology was right — and that is fine, because the group now knows it rather than believes it. And it cannot replace relationships. It tells you where to spend them, and which markets you are already quietly losing.
